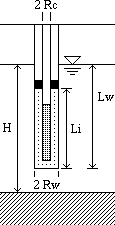
Figure 1. Typical Test Well
Karl DeBisschop
This paper describes a Excel spreadsheet for estimating the hydraulic conductivity of saturated geologic materials. Results are generated simultaneously using the methods of Bouwer and Rice (1976, 1989, 1989a) and of Hvorslev (1951). The spreadsheet-based platform allows open access to calculation formulae, allowing modification and improvement by users.
It is assumed that users are familiar with the theory and practice of slug testing. Once familiar with the operation of the worksheet, users typically perform a complete analysis of ASCII formatted time-level data in 15 to 30 minutes. If data are not of sufficient quality to quickly identify a linear range for analysis, additional evaluation will be required. Workers and managers who encounter such data should evaluate the applicability of the theory supporting this type of analysis and make case-by-case decisions regarding the validity of the results.
Primary features of the worksheet include:
This template may be distributed and used and reproduced freely in accordance with the general public license of the Free Software Foundation (this, however, does not implied that this code was developed or reviewed by the FSF).
The spreadsheet may be downloaded from the project page at Sourceforge
The spreadsheet file is slug096c.xls (the numeric part of the file name reflects the current version number, and will increase with each upgrade). Version 0.95 has been used in practice with Excel 5, but is considered late-BETA because it has not has not undergone a period of open testing. Version 0.96 changes are to convert to Excel 97 (and 2000 when I get a license). Primary goals for Version 1.0 will be to document independent testing, and to incorporate checksum/PGP based verification into the distribution.
Users who update or improve the application are encouraged to submit their modifications for possible inclusion in future versions. In all changes, however, please ensure that all supporting documentation and code is included, and all internal validation data sets and routines remain intact.
All users are encouraged to provide comments and suggestions regarding future improvements to the primary author, Karl DeBisschop (kdebisschop@users.sourceforge.net).
A slug test involves inducing a rapid change in water level in a test well (see note: slug). By measuring and recording the rate of return to static conditions (recovery), one is able to estimate the local horizontal hydraulic conductivity of the material surrounding the well. Slug test data are generally analyzed using relatively standard analytical solutions to the equations which govern groundwater flow. Homogeneity and constant aquifer thickness are common assumptions for conditions within the area of influence of the test. In practice, these are usually met because the radius of influence of most slug tests is fairly small.
Two classes of solutions are generally used in evaluating slug test data. The class of solutions which includes the Bouwer and Rice, and Hvorslev Methods relies on the assumption that water and soil are incompressible - that is, aquifer storativity is zero. This assumption allows use of a modified Thiem equation to predict well response. The potential which drives flow into or out of the well is expressed as a difference between head in the well and at a so-called "radius of influence." Using the somewhat artificial concept of radius of influence eliminates the need to consider aquifer storage in this treatment. (see note: Thiem)
Alternate methods of analysis, including the Cooper-Bredehoeft-Papadopulos method, assume a non-zero storativity which must be calculated to obtain the correct solution. These methods yield solutions analogous to the Theis equation for radial flow to a well. Bedrock aquifers generally meet, in a rough sense, the assumptions of the analysis and may potentially be analyzed with this spreadsheet, though extreme caution should be taken in interpreting the results. For many applications, however, the zone of interest may be a single fracture or discrete fracture zone (e.g. multilevel monitoring wells and packer testing). It may therefore be misleading to present results as hydraulic conductivity without knowing the thickness of the fracture or fracture zone. In such cases, techniques such as CBP may be more appropriate.
Another point of concern lies in the fact that the upper boundary condition for the Thiem analysis is a no-flow boundary, whereas the saturated overburden is more likely to act as a constant head condition. Considering the anisotropy of the roughly horizontal fractures which a vertical well is likely to intersect, direct leakage from overburden will frequently serve simply as the means by which the condition of constant water level at infinite distance is maintained. The satisfaction of this condition, however, cannot generally be confirmed on the basis of the slug test data.
Figure 1 shows a schematic of a typical well installation.
To solve for drawdown in a well following the slug test, consider the Thiem equation:
| Q = 2 π LI K y / ln(RE/RW) | (eq. 1) |
where
The rate of water level change in the well is related to the rate of water level recovery by conservation of mass
| dy/dt = -Q / π RC2 | (eq. 2) |
where RC is the radius of the well casing. Combining these equations and integrating between the limits yo at time = 0 and yt at time = t, yields
| K = (RC2 ln(yo/yt))/ Ft | (eq. 3) |
where F is a shape factor which includes terms dependent on the well geometry.
Although presented in different forms, the time lag procedure described in Hvorslev's original paper is equivalent to the slope of line procedure described by Bouwer and Rice. Therefore, the determination of shape factors is the only substantive difference between Hvorslev's method and the method of Bouwer and Rice.
A series of analytical solutions is presented in Hvorslev (1951). A critical review of shape factors and their validity is presented in Chapuis (1989). Chapuis particularly identifies discrepencies in practice that affect wells with LI/RW less than 16 (for typical environmental wells drilled with an 8-inch auger, this means sand pack lengths less than 5 feet). It is also useful to note that many authors use approximations to the exact analytical shape factors, which are only valid for large length and/or anisotropy. The worksheet currently uses 5 shape factors based on the geometry of the well:
| 4 R for LI=0, LW=0 (a) 5.5 R for LI=0, LW>0 (b) 2 π LI / sqrt(LI/[(2RW) + 0.25]) for LI<16RW (c) 2 π LI / ln[mLI/RW + sqrt(1+[mLI/RW]2)] for LI=LW (d) 2 π LI / ln[mLI/2RW + sqrt(1+[mLI/2RW]2)] for LI<LW (e) |
(eq. 4) |
where the transform factor, m, reflects aquifer anisotropy, and is the square-root of the quotient of horzontal and vertical hydraulic conductivity [(Kh/Kv)1/2]. These formulae are exact representations of the analytical solution, and do not use the approximation for large LI noted above.
Chapuis (1989) also suggests that many cases the contribution of well bottom flow (5.5 R) should be subtracted from the 4c, 4d, and 4e above. In practice, environmental monitoring wells often have a highly permable sand pack which defines the boundary of the well (rather than the actual slotted casing). In such cases, flow does occur through the bottom of the well bore, and this correction is not recommended. For wells in which the gravel pack is not significantly more permeable than the formation, this correction can be applied, but it must be asked in such cases if slug test data are measuring the aquifer response, or the response of the sand pack. For typical environmental applications, the value of this correction term is less than 5 percent. There is a logical parameter in the function definition for determination of the Hvorslev shape factor which, when changed to a non-zero value, causes this correction to be included.
Cedergren (1989) provides additional shape factors for short wells screened at the top of an aquifer and for fully-penetrating wells, but these are not typically used because 1) the appropriate range of applicability is poorly defined, 2) the transition between domains is not smooth, and 3) there is no provision for anisotropy. If well geometries enter this range, a reference to the Cedergren text is provided, and the shape factor formula can be modified on a case-by-case basis if the user wishes to incorporate these cases. Tyical corrections due to this factor seem to be on the order of 20 percent. A parameter is provided in the Hvorslev shape factor definition to control inclusion of this factor.
Bouwer and Rice (1976) proposed a shape factor of the form
| F = 2 p LI / ln(RE /RW) | (eq. 5) |
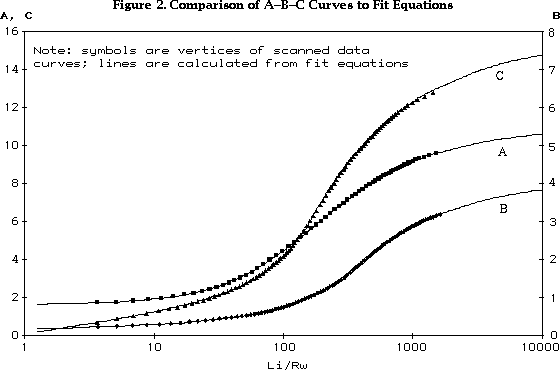
Values for ln(RE/RW) were determined by electrical resistance network for various combinations of well length (LW), well radius (RW), aquifer thickness (H), and intake length (LI). Results of the network simulation are given as curves of three parameters A, B, and C. As part of the development of this spreadsheet, an analytic expression for the values of these parameters was formulated by regression analysis. The resulting expressions are:
| Function A(x) | (eq. 6a) |
| If x < 2.554422663 Then A = 1.638445671 + 0.166908063 * x + 0.000740459 * Exp(6.17105281 * x - 1.054747686 * x * x) Else A = 11.00393028 - 170.7752217 * Exp(-1.509639982 *x) End If |
|
| Function B(x) | (eq. 6b) |
| If x < 2.596774459 Then B = 0.174811819 + 0.060059188 * x + 0.007965502 * Exp(2.053376868 * x - 0.007790328 * x * x) Else B = 4.133124586 - 93.06136936 * Exp(-1.435370997 * x) End If |
|
| Function C(x) | (eq.6c) |
| If x < 2.200426117 Then C = 0.074711376 + 1.083958569 * x + 0.00557352 * Exp(2.929493814 * x - 0.001028433 * x * x) Else C = 15.66887372 - 178.4329289 * Exp(-1.322779744 * x) End If |
|
where x is log(LI/RW). Figure 2 shows a comparison of the values predicted by these equations with the published curves. The RMS error for these curve fits are 0.017 for A (64 data points), 0.0059 for B (88 data points), and 0.048 for C (88 data points). The greatest error is 3 percent, which occurs for small values of B. All other errors are 1 percent or less.
Bouwer (1989) discusses a phenomena he terms the "double straight-line effect" which can occur in wells with a sand pack intersecting the water table. In such situations, the drainage out of or into the sand pack contributes to the volumetric flow term of the governing equations for the slug test. An initial drainage curve is observed, followed by the aquifer response curve on which the analysis should be conducted. An intriguing suggestion in a letter following the 1989 update involves using the known volume of the slug to aid in estimating the porosity or radius of the sand pack for this calculation. In the response, details of this methodology are left for the reader. Two separate treatments of this issue are used for this spreadsheet implementation, either of which can be used based on the judgement of the user. These are discussed under the Casing Radius topic of the Required Data section of this paper.
Another comment in the update indicates that the Bouwer and Rice method is applicable to confined aquifers. There are no intrinsic difficulties in the use of these methods in confined aquifers. Some care, however, is required to choose the correct values for the well geometry. The aquifer thickness is taken, as expected, to be the distance between the upper and lower boundaries of the physical aquifer of concern. The intake length, as described by Bouwer and Rice (1976) is the length of the well screen, or the length of the sand pack or developed zone if significantly more permeable than the aquifer itself. The length of the well is taken as the distance between the upper aquifer surface and the bottom of the well. Casual inspection of Figure 1 in Bouwer and Rice (1976) might suggest that the water table should be taken as the upper surface for these quantities, but it must be remembered that the original paper was written to address the unconfined case only.
The worksheet has been implemented in Excel version 5. Earlier version were implemented in Lotus-123 version 2.3, but no further development is planned in Lotus. User data input fields are all located in column C of the upper 24 lines the spreadsheet, except the water level response data which is enterred or imported starting at row 60.
Well geometry data are recorded both at the time of installation and at the time of testing. The user will generally enter these data manually at the time of test analysis. Although dimensions are labeled in the spreadsheet for convenience, spreadsheet calculations are internally consistent and may be used with any consistent set of units after modifying data labels as required. The following subsections discuss each item in detail.
The aquifer thickness (H) is the total thickness of saturated aquifer material through which flow to the well may take place. In an unconfined aquifer the aquifer extends from the water table to the top of the underlying low-permeability layer. If the depth of the aquifer becomes large, the spreadsheet automatically sets the quantity ln[(H-LW)/RW] to a maximum value of 6 as indicated by Bouwer and Rice (1976).
The well length (LW) is the actual length the well, measured from the top of the aquifer (confining layer or water table) to the bottom of the well, developed zone, or sand pack. In practice, the decision to include the sand pack is based on knowledge of the contrast in grain size between the aquifer and the sand pack material. If the sand pack or developed zone intersects the water table, the presence of the double straight-line effect would suggest that the sand pack or developed zone should be included in the calculations.
The intake length (LI) is the actual length of water flow to the well, sand pack, or developed zone. LI is taken from the top to the bottom of the intake for wells which are entirely below the water table. If the user specifies an intake length greater than the well length, it is assumed that part of the intake lies above the water table. The spreadsheet sets LI to LW and performs all further calculations allowing for sand pack or developed zone drainage.
The casing radius (RC) is always set equal to the radius of the open well bore through which the water column rises or falls. If the intake length is greater than or equal to the well length, it is assumed that the water column also moves through a sand pack or developed zone, and subsequent calculations are performed with a calculated equivalent radius (Requiv). The equivalent radius is calculated according to the formula (Bouwer 1989a):
| Requiv = [(1-n)RC2 + n RW2]1/2 | (eq. 7) |
The calculation of equivalent radius probably is the most subtle aspect of the spreadsheet as implemented, and creates the greatest potential for user error or misinterpretation. Discussion of the implications of these substitutions and related derivations will recur throughout this documentation. If the double straight-line effect is not apparent in plots of the time-drawdown data, substitution of Requiv for RC can be defeated by setting LI slightly less than LW.
If a spreadsheet calculations are performed in the "drained" mode, hydraulic conductivity will be calculated by each of three different methods:
In practice, result of the second and third substitutions will be very similar. Regardless of the substitution chosen, it is important to confirm that the porosity and well radius predicted by fluid balance constraints are realistic. The spreadsheet includes a warning to this effect if the predicted porosity is less than 10 percent or greater than 50 percent.
The well radius (RW) is the radius of the sand pack or developed zone, if present. If no sand pack or developed zone is present, the well radius is the outside radius of the well screen.
In practice, the decision to include the sand pack is based on knowledge of the contrast between the grain size distributions of the aquifer and the sand pack material. If the sand pack or developed zone intersects the water table, the presence of the double straight-line effect would suggest that the sand pack or developed zone should be included in the calculations.
Additional data are described below.
An estimate of the sand pack porosity (n) is provided by the user. This value is only significant if the well geometry is drained. In such cases, a second estimate of porosity is calculated by the spreadsheet from regressed drawdown data and well geometry.
It is essential to know the volume of the slug used for the test in order to conduct quality assurance checks on slug test results. This information is also used to estimate Requiv for drained well geometries.
Many electronic data loggers save the static water level as the first recorded value. The spreadsheet assumes this behavior and copies the value into this cell during data import via macro. The user should always verify that the static level is set correctly prior to performing regression on the straight-line portion of the response curve, and may substitute another value into this cell if required.
The offset time allows the user to correct for a time lag between initiation of data acquisition and the onset of the slug test. This value is only used for determination of Requiv, and therefore is only significant for drained well geometries, which use an estimated of sand pack porosity or well radius. Undrained well calculations are not affected, nor are calculations based on user defined porosity and well radius.
Water level recovery data are generally recorded with an electronic data logging device (e.g. Thor, Hermit, Troll) and imported into the spreadsheet as an ASCII file. Macros used to automate importation of data assume that each data file consists of a series of data pairs separated by spaces or tabs. Each data pair consists of the time and the measured water level. By manually importing data, other formats may be accommodated.
Input of time-drawdown pairs generated automatically by the data-logger is discouraged. The procedure used by many system is prone to error if the transducer is disturbed, and quality assurance is reduced by uncritical acceptance of such data. Adopting a practice of importing water levels, rather than drawdown, encourages the user to be more careful in evaluating the data (see note: Using data loggers).
The basic procedure for analysis of slug test data includes the following steps:
These will generally be accomplished through macros built into the spreadsheet, but may also be conducted by direct access to spreadsheet cells and functions.
To import data using the macro feature, chose "Import..." from the TOOLS menu.
The regression is performed auotmatically based on the range vales enterred by the user (cells B32 and B33). By changing these values, the user selects the rows that will be regressed and achieves a good fit to the linear portion of the data. If the well and aquifer geometry data has been entered, the test result shown by the spreadsheet may be correct at this point. For responsible analysis, however, a few more items should be evaluated.
If this is a drained well geometry, are the predicted well radius and sand pack porosity reasonable? Do the data indicate a clear double straight-line effect? If either of these conditions are not met, consider forcing to analysis to the undrained calculation by increasing the well length to a value slightly greater than the intake length.
If this is an undrained well geometry, does your known slug volume compare well to the change in water level observed? If not, explain the discrepancy, take steps to ensure that future tests are more accurate and reproducible, and consider whether a drained geometry may apply.
In addition to this document, general program help is available from the instructions worksheet of the application. Error mesagges and warnings are described on the sheet called errors.
As distributed, the spreadsheet programs contain validation data from Bouwer and Rice (1976), and from Domenico and Schwartz (1996) for the Hvorslev method. If during use of the spreadsheet, there is reason to belive that program internals have been modified and are no longer accurate, these validation tests can be invoked by running the validate macro. The correct results are also integral to the program and will be printed in the comments section for each test.
This integral documentation of the accuracy of the worksheet implementation is a is an essential feature of the worksheet, and should be made available to all parties reviewing slug test analyses conducted with this worksheet.
Basic procedures for conducting slug tests have been described in many references. In general, the test is conducted by adding (or removing) a slug to raise (or lower) the water level from its original equilibrium level, and measuring the rate of water level recovery. Other means of displacing the water column, such as compressed air, are equally amenable to analysis by these methods. Due to the relatively long duration of the "slug", the method of directly adding water to the well is not used frequently in current practice.
Water level changes are usually measured with pressure transducers and recorded by an electronic data logger. This equipment has the primary advantage of allowing measurement as water level recovery in wells with very rapid response times. This section will describe a few tip and tricks that can help produce more useful and defensible test data. A more complete description of the procedure and equipment required is presented in Attachment A.
See also:
The following measures will help ensure quality data and analytical procedures.